
Combinatorially explode your experiments
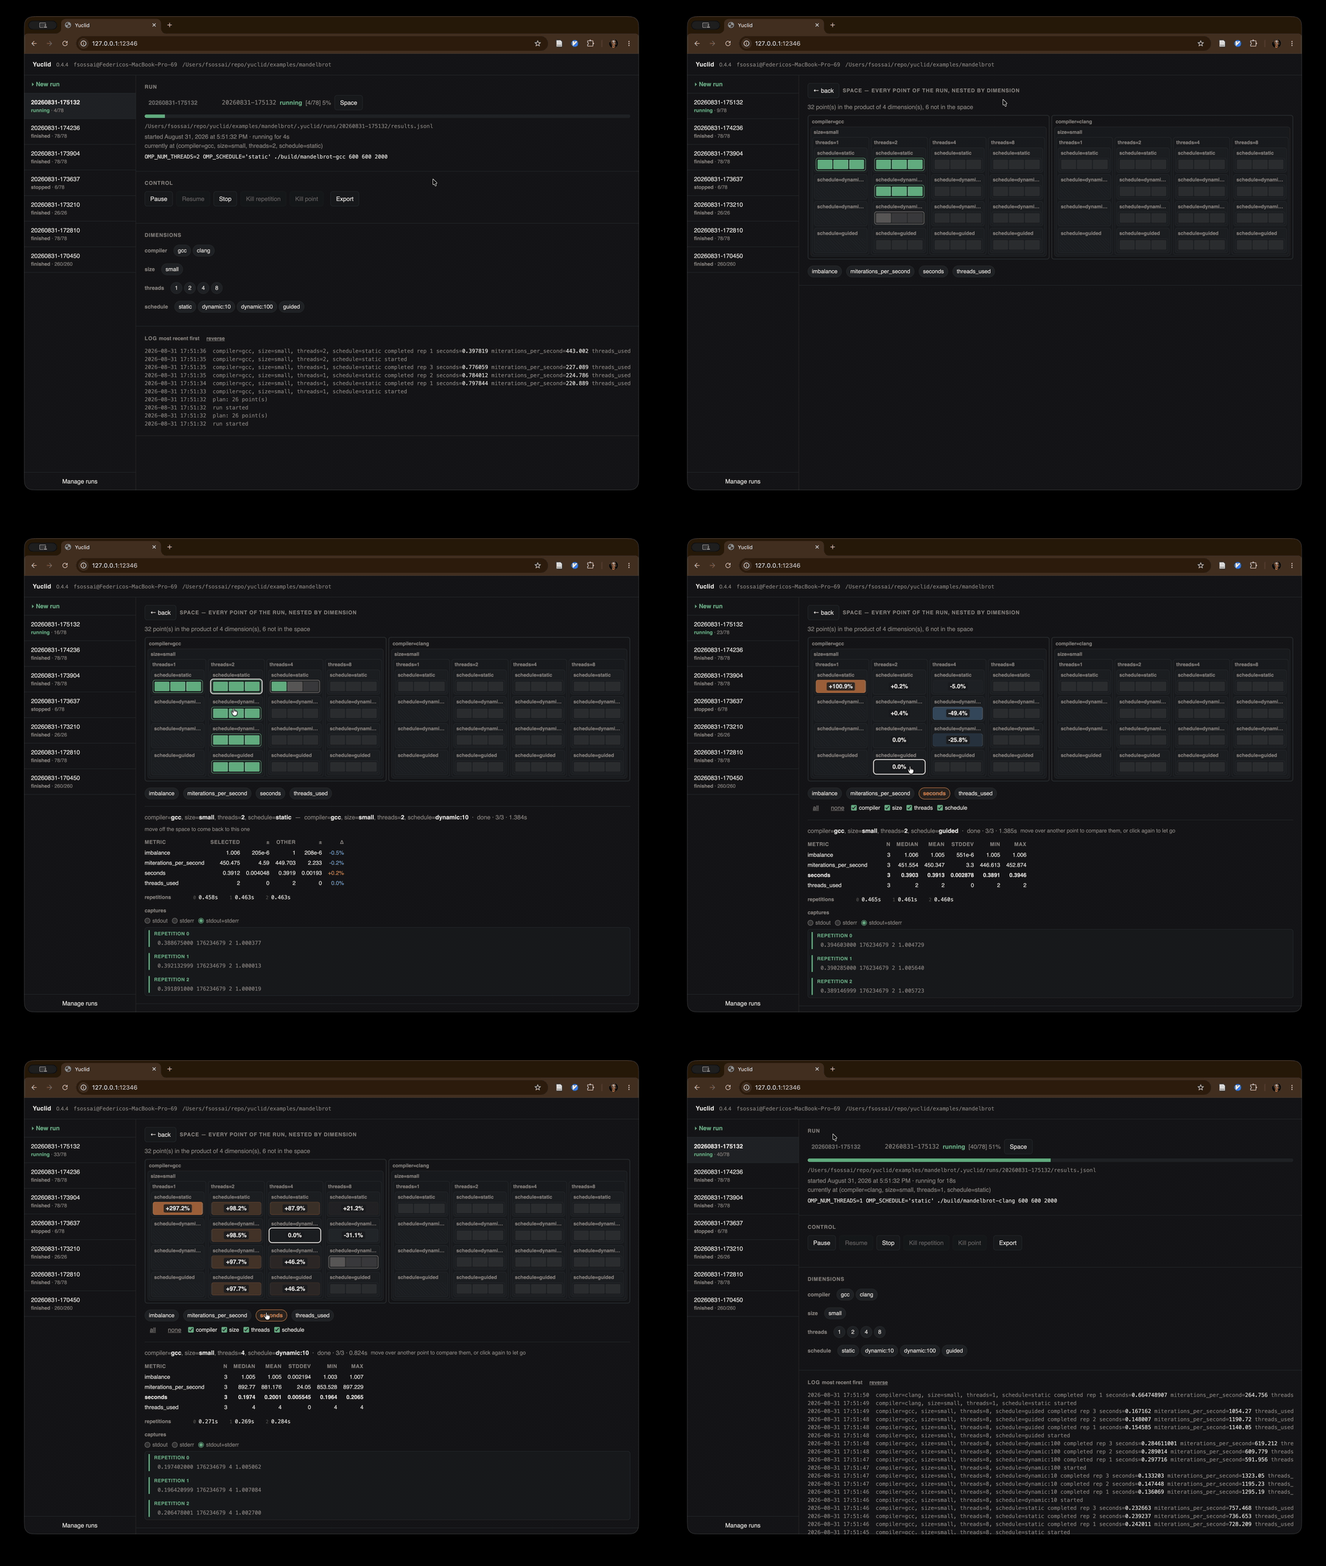
Yuclid is a command-line tool with a Web UI for orchestrating and visualizing experiments across irregular, N-dimensional parameter spaces. It collects custom metrics in a single JSONL file for easy post-processing. Yuclid builds the Cartesian product of the dimensions you define and runs an experiment at each point in that space. Experiments can be monitored and steered in real-time via CLI or Web UI.
Check out the examples.
Requires python >= 3.10
Development head:
pip install git+https://github.com/fsossai/yuclid.git
Stable release:
pip install yuclid
The main workflow is to run an experiment, watch or steer it while it is in progress, then inspect and visualize the resulting dataset.
yuclid runbuilds the configured space, executes every selected point, and writes its dimensions and metrics to JSON Lines or CSV.yuclid serveopens the browser interface for watching, launching, and steering runs recorded in the current directory.yuclid statusreports the progress of a live run;--watchkeeps the report current until it ends.yuclid runslists recent recorded runs and their result files.
yuclid pauseandyuclid resumetemporarily stop and continue scheduling work.yuclid dropremoves matching points from the remaining plan;yuclid addrestores them or extends the plan with new values.yuclid repeatchanges the repetition count for remaining points, andyuclid orderchanges their traversal order.yuclid killabandons a point or repetition currently in flight;yuclid stopends the run and interrupts its active commands.
yuclid finishmeasures the points a previous run left without results.yuclid replayoptimistically runs a previous run again, preserving its intended points and repetitions while retrying failures.
yuclid describesummarizes a result file and reports missing points.yuclid plotexplores slices of a dataset in a graphical interface.yuclid tplotprovides the interactive plotter in a terminal.yuclid statsplots the distribution of a selected metric.
A plot puts one dimension on the horizontal axis, uses another for the series, and leaves the rest free. The arrow keys walk through those, so one command is a whole family of plots rather than a single picture — which is what the two animations below are stepping through:
yuclid plot results.jsonl -x threads -z schedule -y seconds -R threads=1 schedule=static compiler=gcc -r -l -A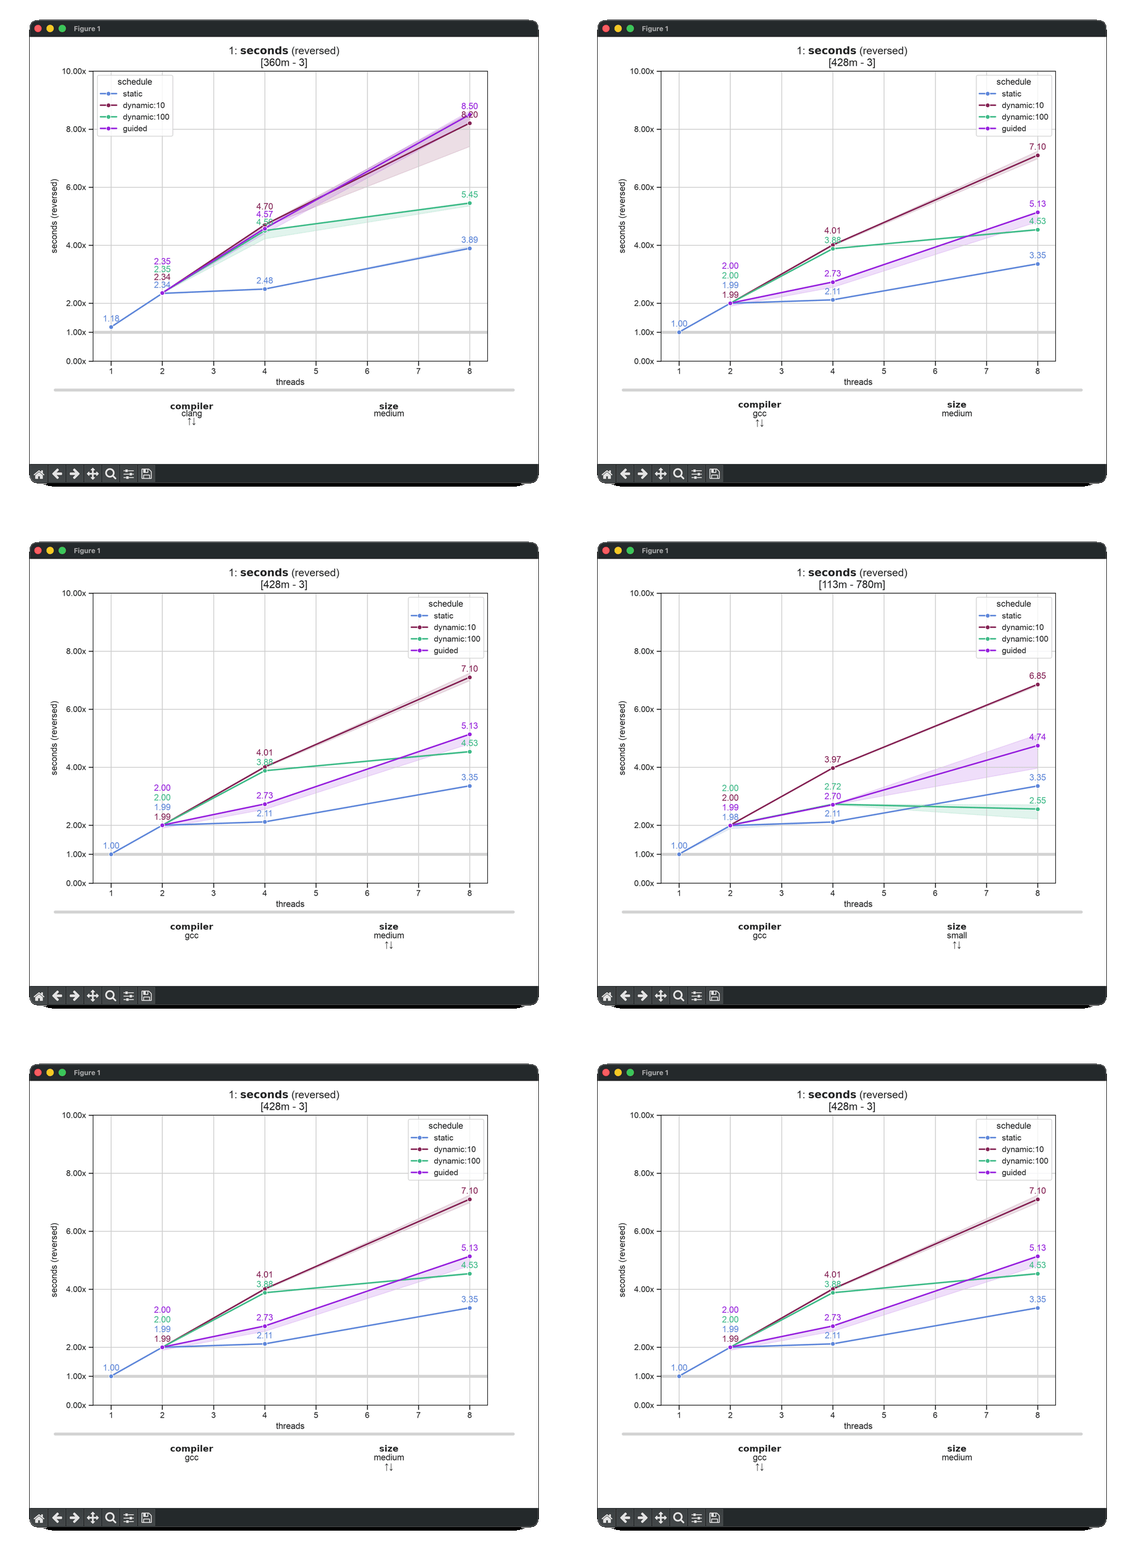
yuclid plot results.jsonl -x threads -z compiler -y seconds -A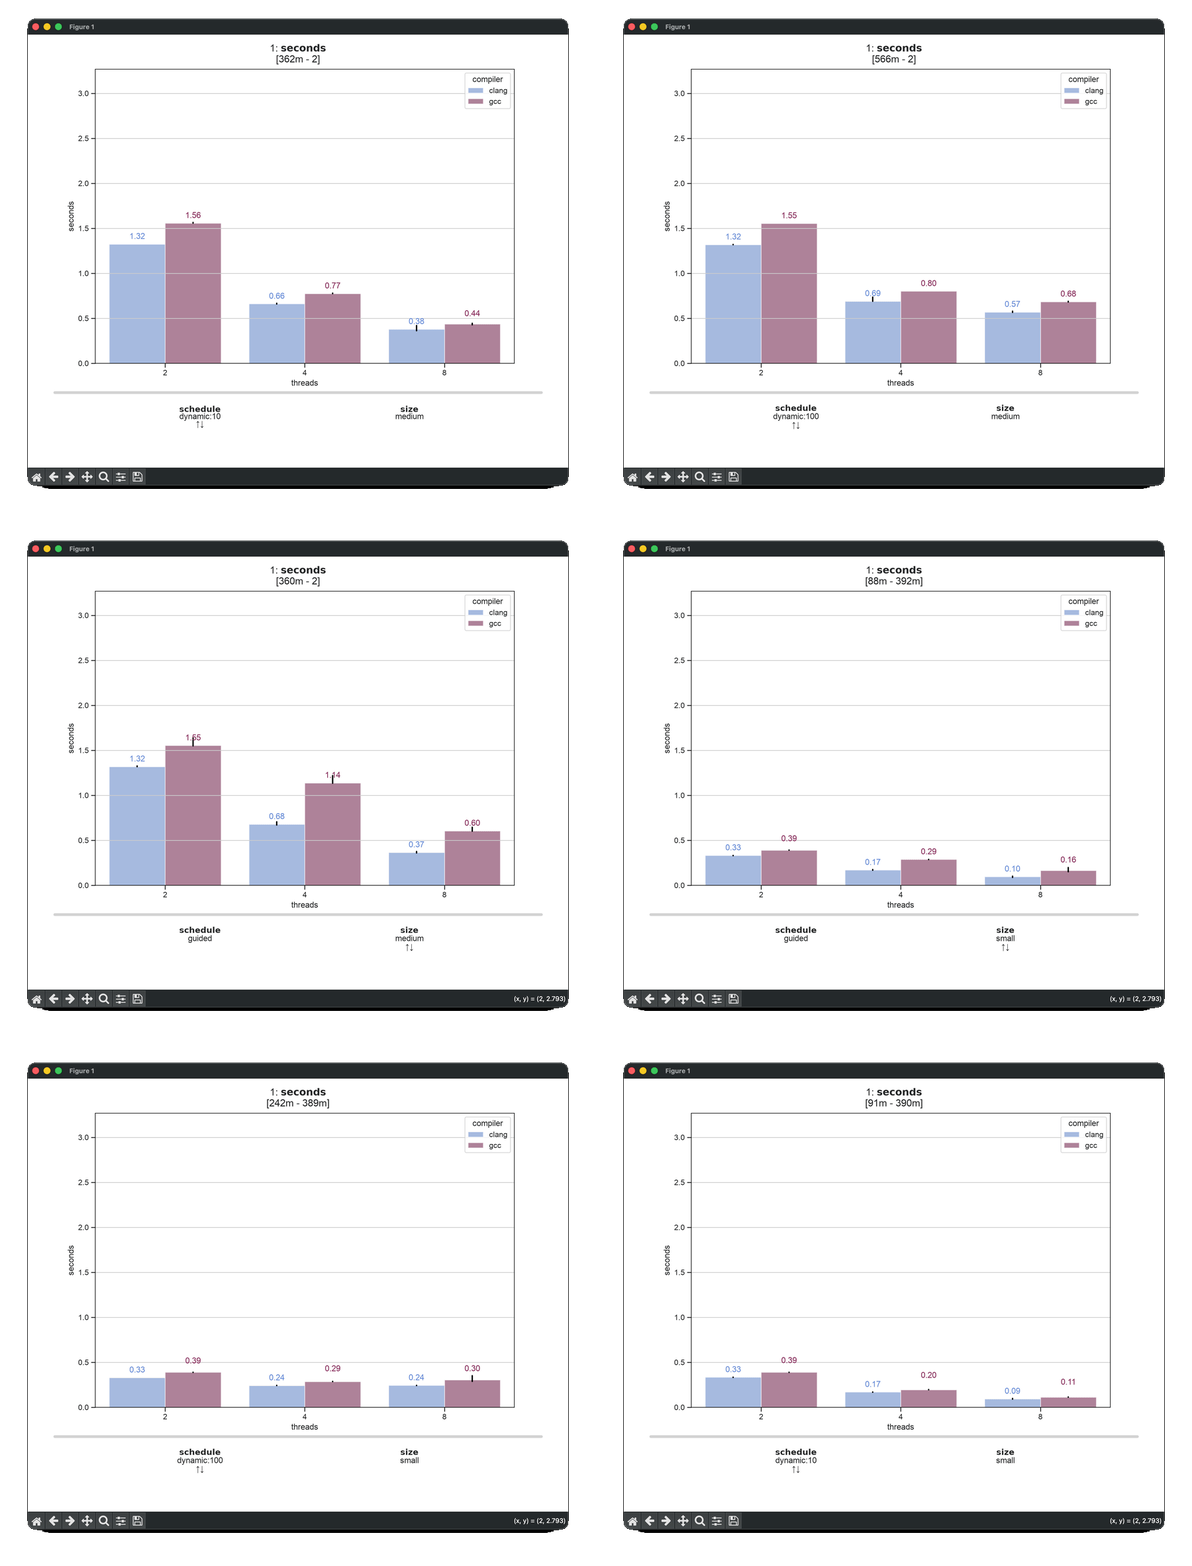
yuclid skillsinstalls or uninstalls Yuclid's configuration and plotting skills for Codex, Claude, or a custom Agent Skills directory.
Run yuclid <command> --help for the complete options of any subcommand.
See Configuration.
Yuclid includes skills for agents that support the Agent Skills format. A few examples of how to install them:
yuclid skills install --agent codex                 # Codex, user-wide
yuclid skills install --agent claude                # Claude, user-wide
yuclid skills install --directory .agents/skills # custom or project directoryyuclid-configwrites and fixes a configuration: the space, the trials, and the commands that extract metrics from their output.yuclid-plotreads a result file, suggests useful views, and produces ready-to-runyuclid plot,tplot, andstatscommands.
yuclid run --compile experiment.sh writes a shell script instead of running
anything. Every point of the space is unrolled, so the script contains no loops
and no branches — just the commands, in the order yuclid would have run them:
yuclid run -p quick --compile experiment.sh
sh experiment.sh                    # no yuclid, no configuration needed