Repository navigation
Conversation


 lunelson
added
area/infra
lunelson
added
area/infra

|
The latest updates on your projects. Learn more about Vercel for GitHub.
1 Skipped Deployment
|



 github-actions
Bot
added
area/apps > hash*
github-actions
Bot
added
area/apps > hash*


Codecov Report✅ All modified and coverable lines are covered by tests. Additional details and impacted files@@ Coverage Diff @@
## main #9987 +/- ##
=======================================
Coverage 67.97% 67.97%
=======================================
Files 1946 1946
Lines 201776 201776
Branches 8317 8317
=======================================
Hits 137164 137164
Misses 62987 62987
Partials 1625 1625
Flags with carried forward coverage won't be shown. Click here to find out more. ☔ View full report in Codecov by Harness. 🚀 New features to boost your workflow:
|

Merging this PR will not alter performance
|
| Benchmark | BASE |
HEAD |
Efficiency | |
|---|---|---|---|---|
as_constant |
< 1 ns | < 1 ns | N/A | |
constant_equal |
< 1 ns | < 1 ns | N/A | |
constant_not_equal |
< 1 ns | < 1 ns | N/A | |
access |
< 1 ns | < 1 ns | N/A | |
runtime_equal |
< 1 ns | < 1 ns | N/A | |
runtime_not_equal |
< 1 ns | < 1 ns | N/A |
Comparing ln/speed-up-playwright-ci (1360eec) with main (51755b6)
 github-actions
Bot
removed
the
area/infra
github-actions
Bot
removed
the
area/infra

30602a7 to
b2c22ea
Compare
github-actions
Bot
removed
area/apps > hash-api
github-actions
Bot
added
the
area/libs

Co-authored-by: Cursor <cursoragent@cursor.com>
a705411 to
e3018a6
Compare
github-actions
Bot
removed
the
area/libs

Benchmark results
|
| Function | Value | Mean | Flame graphs |
|---|---|---|---|
| resolve_policies_for_actor | user: empty, selectivity: high, policies: 2002 | Flame Graph | |
| resolve_policies_for_actor | user: empty, selectivity: low, policies: 1 | Flame Graph | |
| resolve_policies_for_actor | user: empty, selectivity: medium, policies: 1002 | Flame Graph | |
| resolve_policies_for_actor | user: seeded, selectivity: high, policies: 3314 | Flame Graph | |
| resolve_policies_for_actor | user: seeded, selectivity: low, policies: 1 | Flame Graph | |
| resolve_policies_for_actor | user: seeded, selectivity: medium, policies: 1527 | Flame Graph | |
| resolve_policies_for_actor | user: system, selectivity: high, policies: 2078 | Flame Graph | |
| resolve_policies_for_actor | user: system, selectivity: low, policies: 1 | Flame Graph | |
| resolve_policies_for_actor | user: system, selectivity: medium, policies: 1033 | Flame Graph |


policy_resolution_medium
| Function | Value | Mean | Flame graphs |
|---|---|---|---|
| resolve_policies_for_actor | user: empty, selectivity: high, policies: 102 | Flame Graph | |
| resolve_policies_for_actor | user: empty, selectivity: low, policies: 1 | Flame Graph | |
| resolve_policies_for_actor | user: empty, selectivity: medium, policies: 52 | Flame Graph | |
| resolve_policies_for_actor | user: seeded, selectivity: high, policies: 269 | Flame Graph | |
| resolve_policies_for_actor | user: seeded, selectivity: low, policies: 1 | Flame Graph | |
| resolve_policies_for_actor | user: seeded, selectivity: medium, policies: 108 | Flame Graph | |
| resolve_policies_for_actor | user: system, selectivity: high, policies: 133 | Flame Graph | |
| resolve_policies_for_actor | user: system, selectivity: low, policies: 1 | Flame Graph | |
| resolve_policies_for_actor | user: system, selectivity: medium, policies: 63 | Flame Graph |


policy_resolution_none
| Function | Value | Mean | Flame graphs |
|---|---|---|---|
| resolve_policies_for_actor | user: empty, selectivity: high, policies: 2 | Flame Graph | |
| resolve_policies_for_actor | user: empty, selectivity: low, policies: 1 | Flame Graph | |
| resolve_policies_for_actor | user: empty, selectivity: medium, policies: 2 | Flame Graph | |
| resolve_policies_for_actor | user: system, selectivity: high, policies: 8 | Flame Graph | |
| resolve_policies_for_actor | user: system, selectivity: low, policies: 1 | Flame Graph | |
| resolve_policies_for_actor | user: system, selectivity: medium, policies: 3 | Flame Graph |


policy_resolution_small
| Function | Value | Mean | Flame graphs |
|---|---|---|---|
| resolve_policies_for_actor | user: empty, selectivity: high, policies: 52 | Flame Graph | |
| resolve_policies_for_actor | user: empty, selectivity: low, policies: 1 | Flame Graph | |
| resolve_policies_for_actor | user: empty, selectivity: medium, policies: 26 | Flame Graph | |
| resolve_policies_for_actor | user: seeded, selectivity: high, policies: 94 | Flame Graph | |
| resolve_policies_for_actor | user: seeded, selectivity: low, policies: 1 | Flame Graph | |
| resolve_policies_for_actor | user: seeded, selectivity: medium, policies: 27 | Flame Graph | |
| resolve_policies_for_actor | user: system, selectivity: high, policies: 66 | Flame Graph | |
| resolve_policies_for_actor | user: system, selectivity: low, policies: 1 | Flame Graph | |
| resolve_policies_for_actor | user: system, selectivity: medium, policies: 29 | Flame Graph |


read_scaling_complete
| Function | Value | Mean | Flame graphs |
|---|---|---|---|
| entity_by_id;one_depth | 1 entities | Flame Graph | |
| entity_by_id;one_depth | 10 entities | Flame Graph | |
| entity_by_id;one_depth | 25 entities | Flame Graph | |
| entity_by_id;one_depth | 5 entities | Flame Graph | |
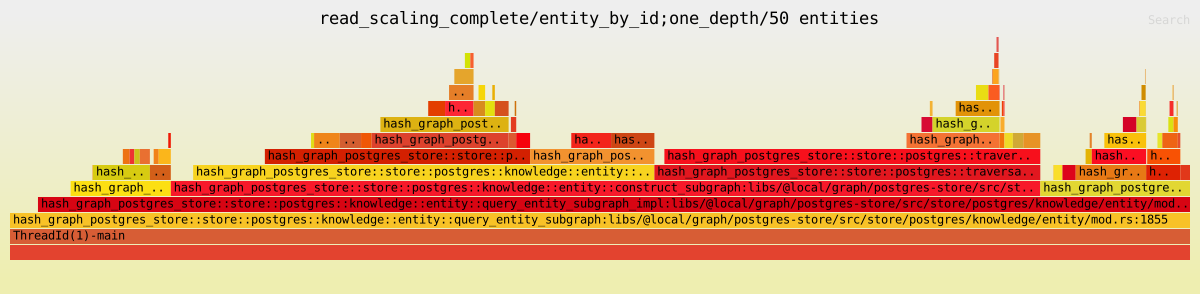
| entity_by_id;one_depth | 50 entities | Flame Graph | |
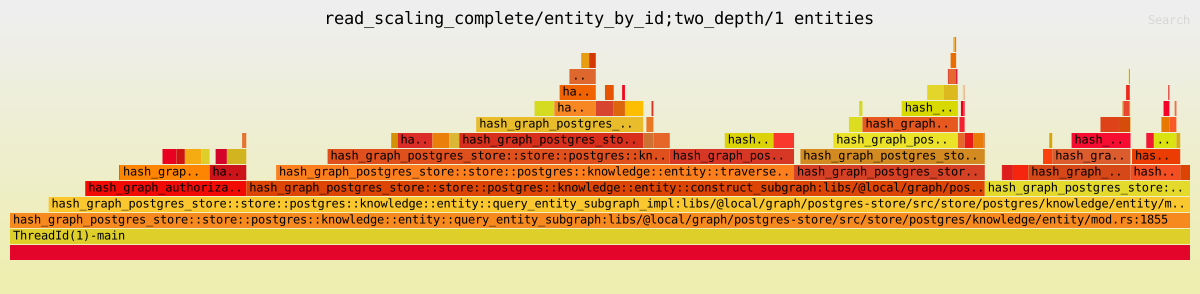
| entity_by_id;two_depth | 1 entities | Flame Graph | |
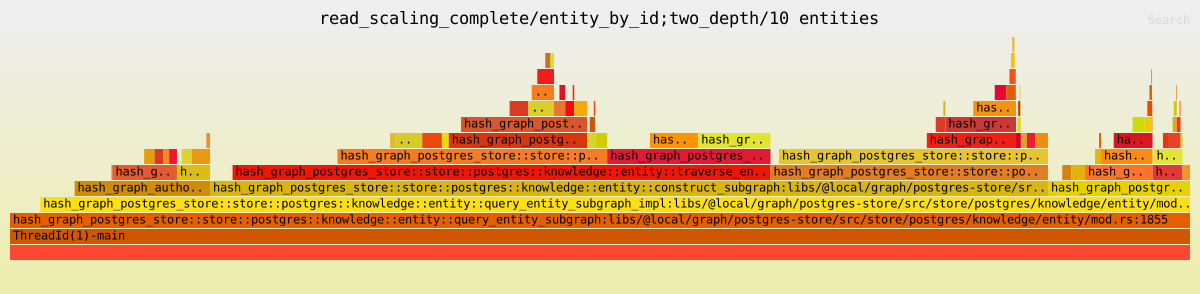
| entity_by_id;two_depth | 10 entities | Flame Graph | |
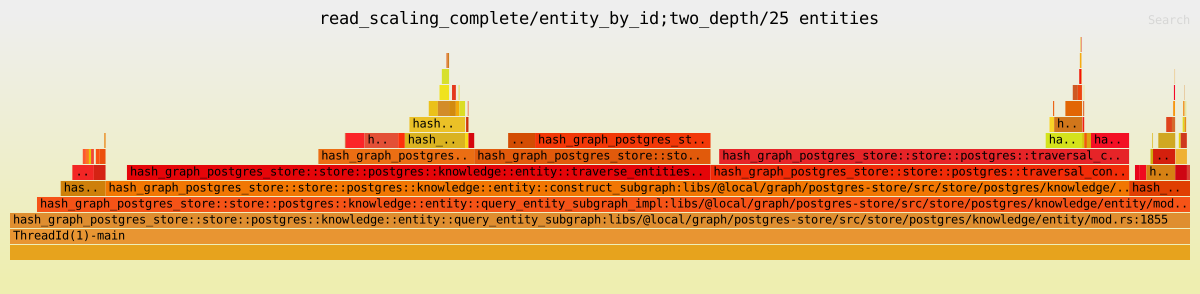
| entity_by_id;two_depth | 25 entities | Flame Graph | |
| entity_by_id;two_depth | 5 entities | Flame Graph | |
| entity_by_id;two_depth | 50 entities | Flame Graph | |
| entity_by_id;zero_depth | 1 entities | Flame Graph | |
| entity_by_id;zero_depth | 10 entities | Flame Graph | |
| entity_by_id;zero_depth | 25 entities | Flame Graph | |
| entity_by_id;zero_depth | 5 entities | Flame Graph | |
| entity_by_id;zero_depth | 50 entities | Flame Graph |
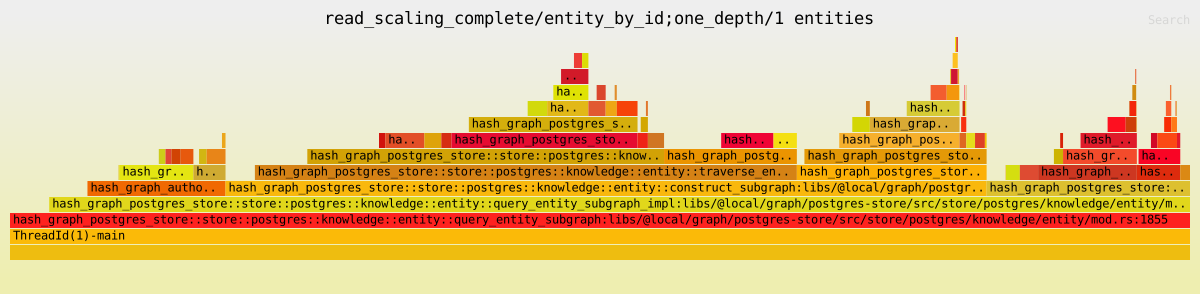
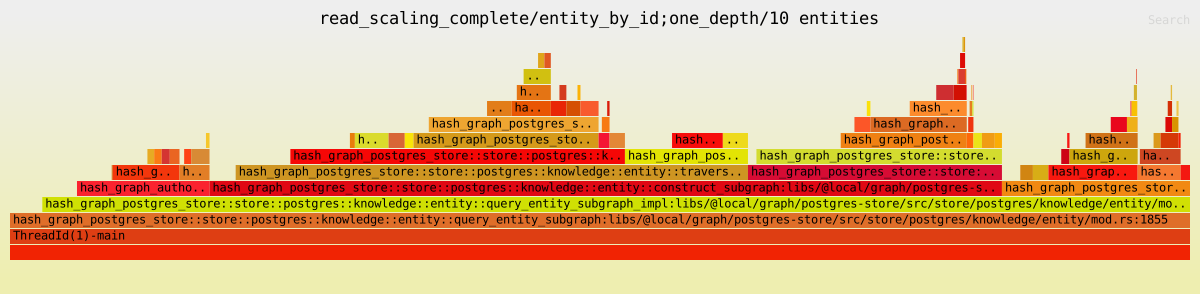
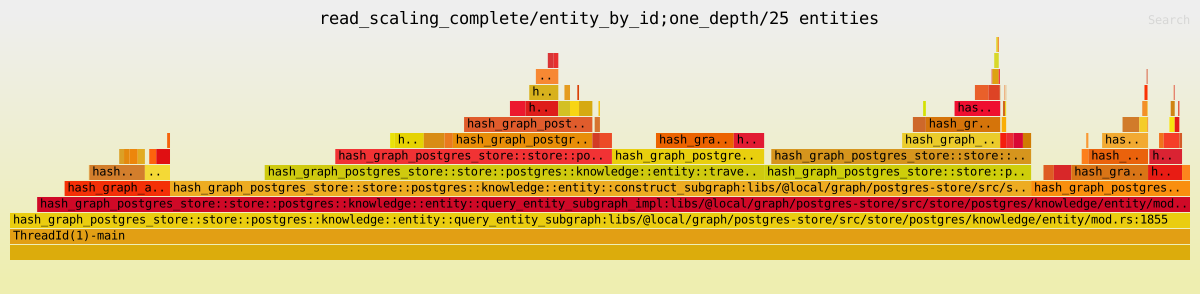
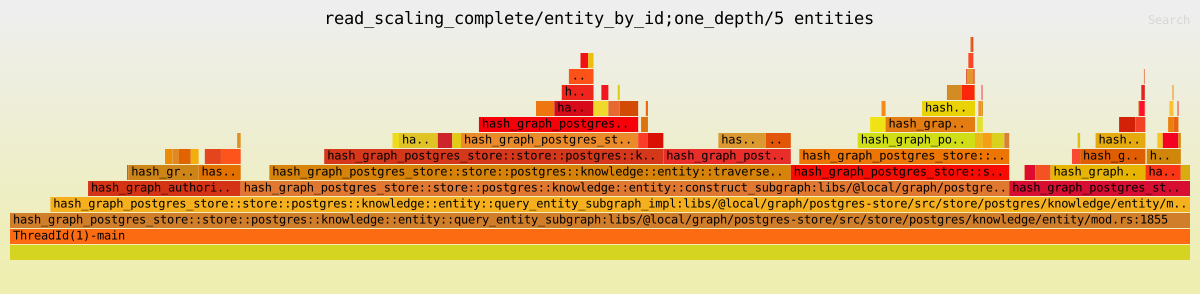
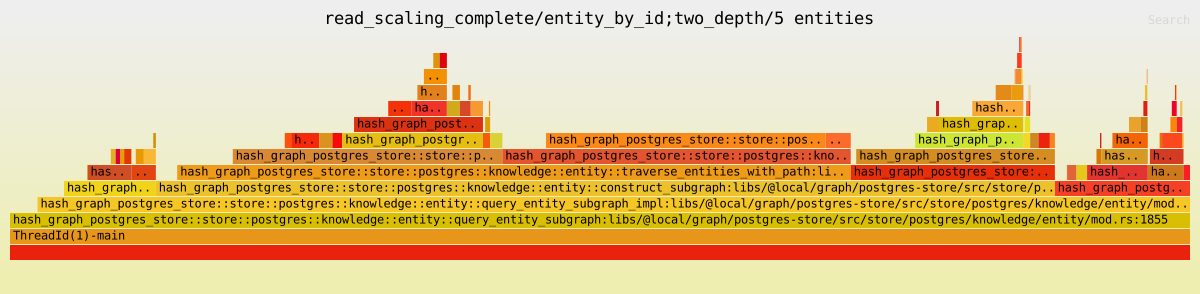
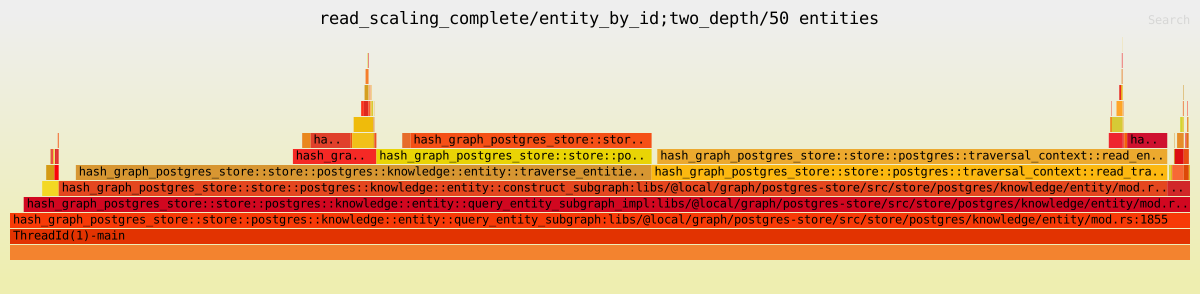
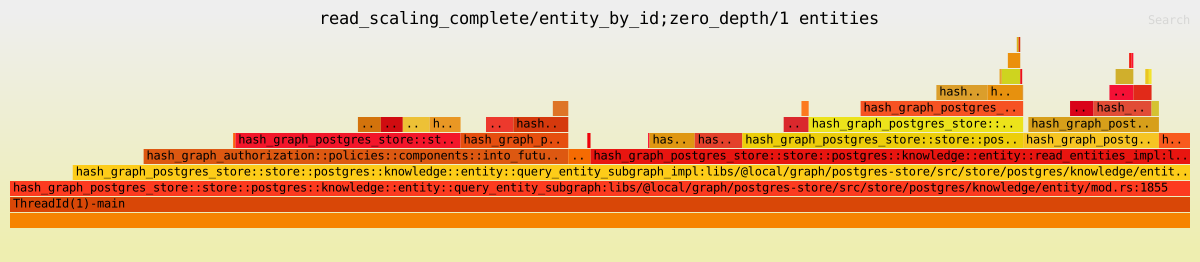
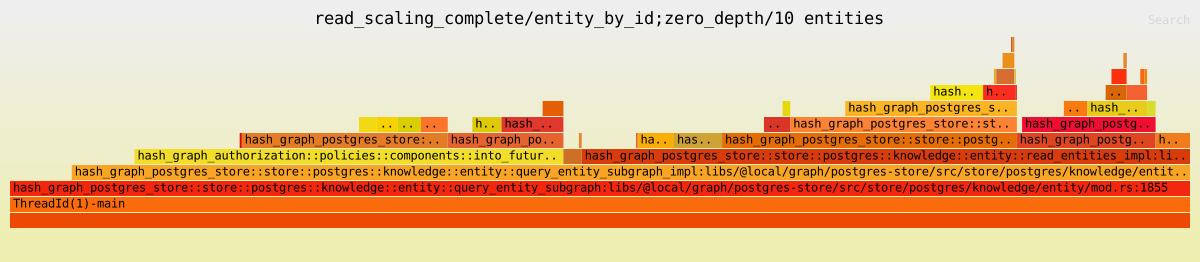
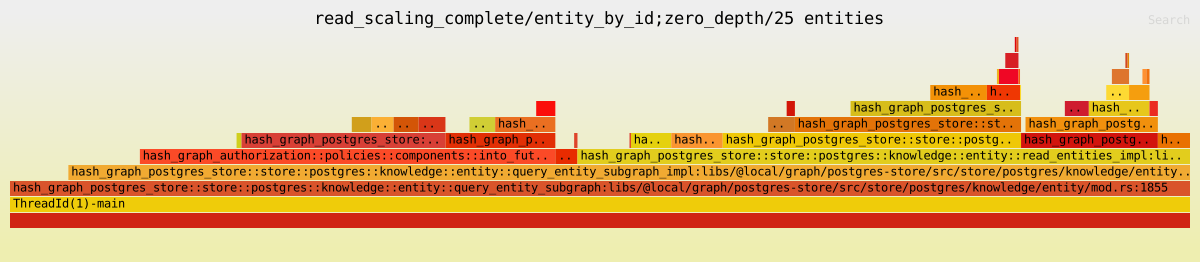
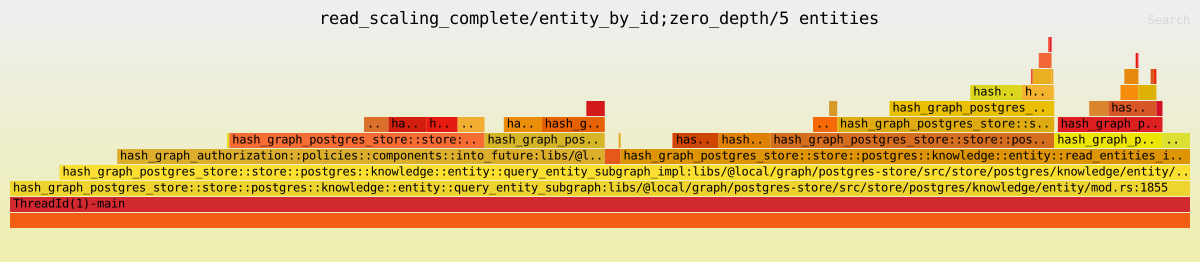
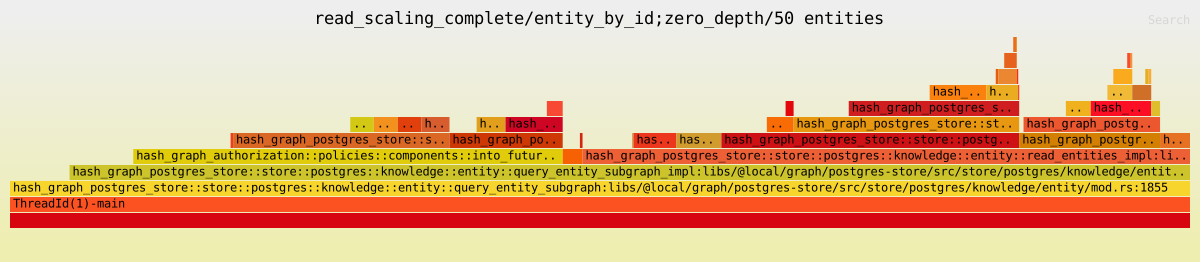
read_scaling_linkless
| Function | Value | Mean | Flame graphs |
|---|---|---|---|
| entity_by_id | 1 entities | Flame Graph | |
| entity_by_id | 10 entities | Flame Graph | |
| entity_by_id | 100 entities | Flame Graph | |
| entity_by_id | 1000 entities | Flame Graph | |
| entity_by_id | 10000 entities | Flame Graph |
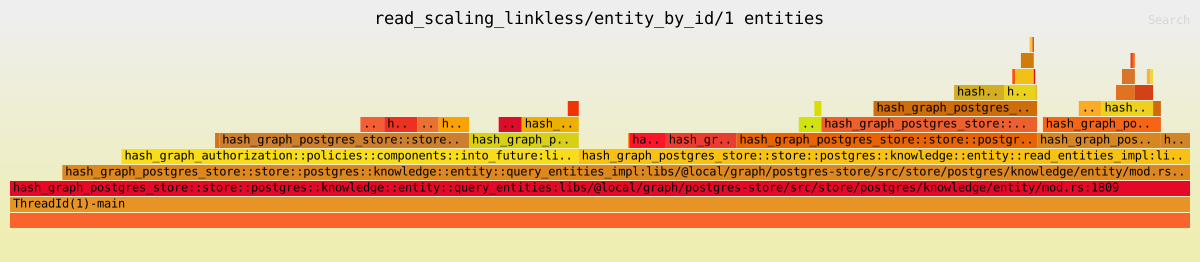
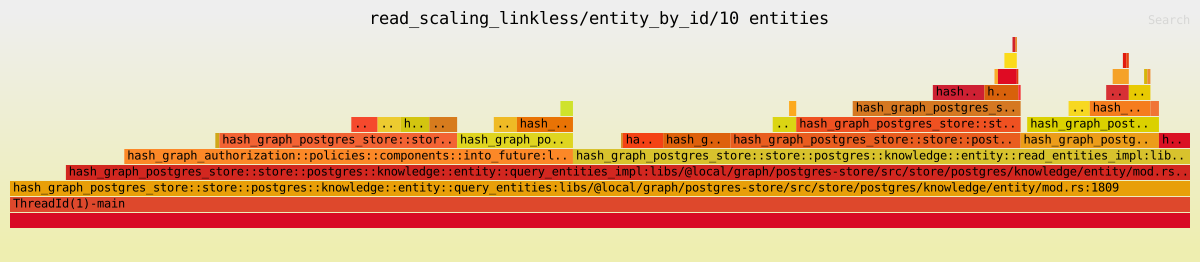
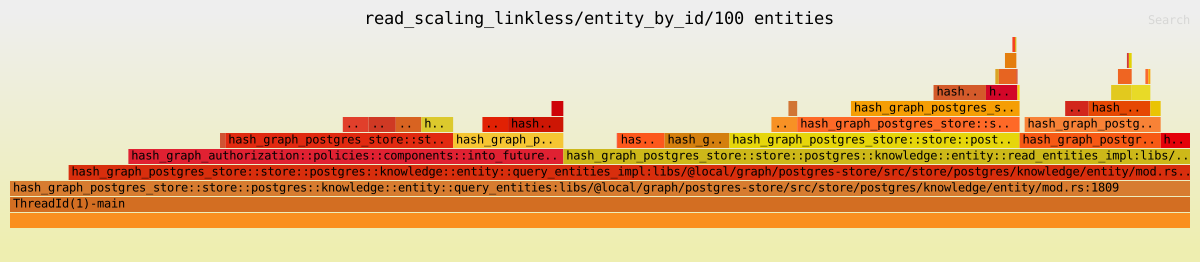
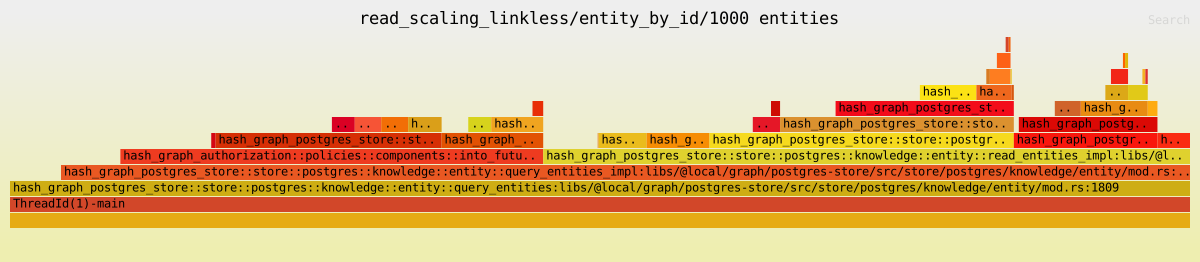
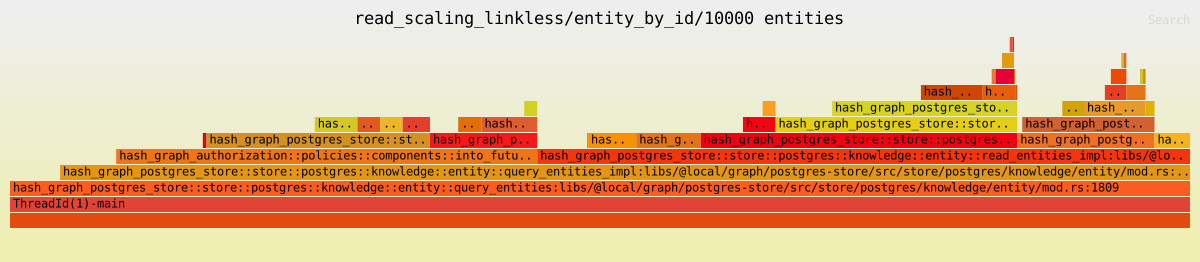
representative_read_entity
| Function | Value | Mean | Flame graphs |
|---|---|---|---|
| entity_by_id | entity type ID: https://blockprotocol.org/@alice/types/entity-type/block/v/1
|
Flame Graph | |
| entity_by_id | entity type ID: https://blockprotocol.org/@alice/types/entity-type/book/v/1
|
Flame Graph | |
| entity_by_id | entity type ID: https://blockprotocol.org/@alice/types/entity-type/building/v/1
|
Flame Graph | |
| entity_by_id | entity type ID: https://blockprotocol.org/@alice/types/entity-type/organization/v/1
|
Flame Graph | |
| entity_by_id | entity type ID: https://blockprotocol.org/@alice/types/entity-type/page/v/2
|
Flame Graph | |
| entity_by_id | entity type ID: https://blockprotocol.org/@alice/types/entity-type/person/v/1
|
Flame Graph | |
| entity_by_id | entity type ID: https://blockprotocol.org/@alice/types/entity-type/playlist/v/1
|
Flame Graph | |
| entity_by_id | entity type ID: https://blockprotocol.org/@alice/types/entity-type/song/v/1
|
Flame Graph | |
| entity_by_id | entity type ID: https://blockprotocol.org/@alice/types/entity-type/uk-address/v/1
|
Flame Graph |


representative_read_entity_type
| Function | Value | Mean | Flame graphs |
|---|---|---|---|
| get_entity_type_by_id | Account ID: bf5a9ef5-dc3b-43cf-a291-6210c0321eba
|
Flame Graph |

representative_read_multiple_entities
| Function | Value | Mean | Flame graphs |
|---|---|---|---|
| entity_by_property | traversal_paths=0 | 0 | |
| entity_by_property | traversal_paths=255 | 1,resolve_depths=inherit:1;values:255;properties:255;links:127;link_dests:126;type:true | |
| entity_by_property | traversal_paths=2 | 1,resolve_depths=inherit:0;values:0;properties:0;links:0;link_dests:0;type:false | |
| entity_by_property | traversal_paths=2 | 1,resolve_depths=inherit:0;values:0;properties:0;links:1;link_dests:0;type:true | |
| entity_by_property | traversal_paths=2 | 1,resolve_depths=inherit:0;values:0;properties:2;links:1;link_dests:0;type:true | |
| entity_by_property | traversal_paths=2 | 1,resolve_depths=inherit:0;values:2;properties:2;links:1;link_dests:0;type:true | |
| link_by_source_by_property | traversal_paths=0 | 0 | |
| link_by_source_by_property | traversal_paths=255 | 1,resolve_depths=inherit:1;values:255;properties:255;links:127;link_dests:126;type:true | |
| link_by_source_by_property | traversal_paths=2 | 1,resolve_depths=inherit:0;values:0;properties:0;links:0;link_dests:0;type:false | |
| link_by_source_by_property | traversal_paths=2 | 1,resolve_depths=inherit:0;values:0;properties:0;links:1;link_dests:0;type:true | |
| link_by_source_by_property | traversal_paths=2 | 1,resolve_depths=inherit:0;values:0;properties:2;links:1;link_dests:0;type:true | |
| link_by_source_by_property | traversal_paths=2 | 1,resolve_depths=inherit:0;values:2;properties:2;links:1;link_dests:0;type:true |
scenarios
| Function | Value | Mean | Flame graphs |
|---|---|---|---|
| full_test | query-limited | Flame Graph | |
| full_test | query-unlimited | Flame Graph | |
| linked_queries | query-limited | Flame Graph | |
| linked_queries | query-unlimited | Flame Graph |
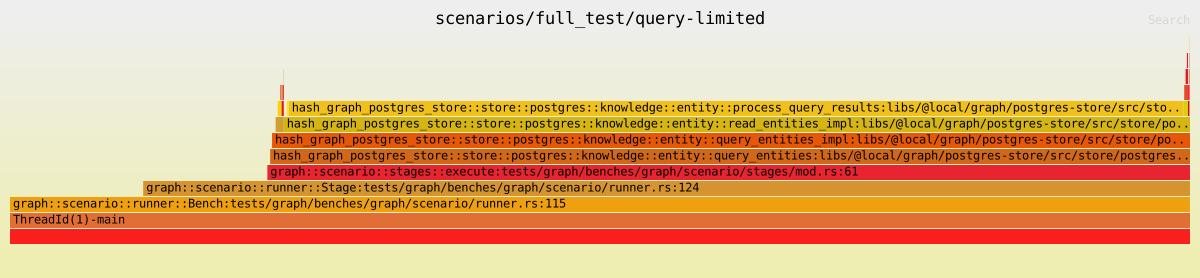
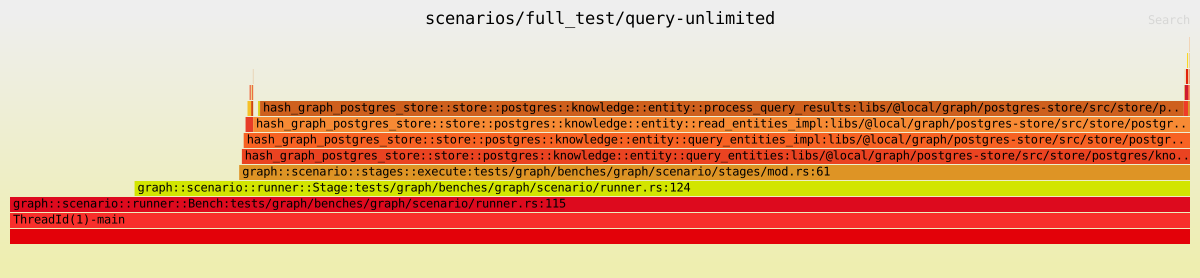
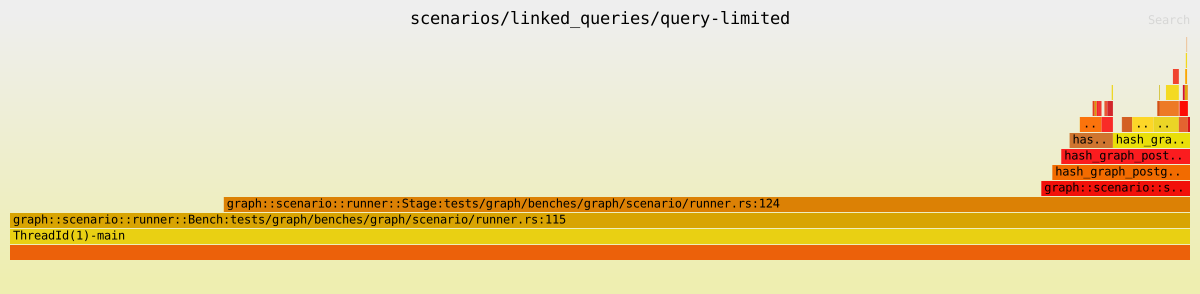
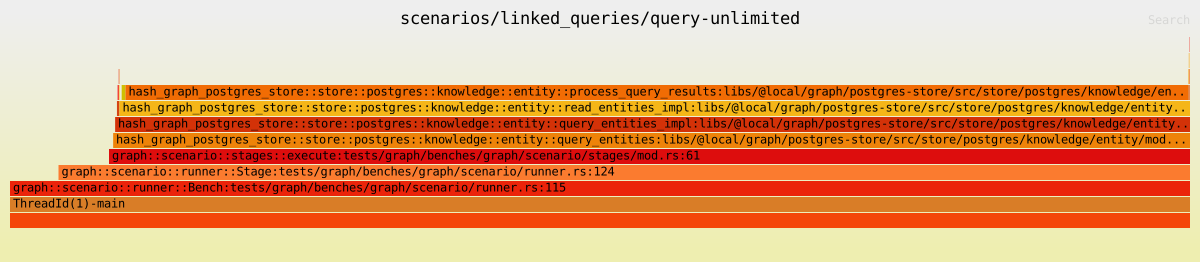
|
Closing without merging. Caching only the binary is too fragile: in the last warm re-run a later |
This branch was successfully deployed
1 participant

Note
This is a test PR, not ready to merge. It measures whether caching the
hash-graphdebug binary is safe and worthwhile. Enabling this caching is now tracked in SRE-1174 (internal); this PR is the experiment behind it.🌟 Purpose
The Playwright integration job took 18–25 minutes on pull requests. Most of that was not installing dependencies or Playwright (the browser install takes about 8 seconds). Each run compiles the
hash-graphbinary before any service starts, andhash-graph#compileiscache: false. That compile took 4.5–5 minutes even though sccache hits about 99% of the time. Thehash-graph-integration,hash-graph-benches,@tests/hash-graph-httpand@tests/hash-backend-integrationjobs pay the same cost. #10005 measured where those minutes go.Three changes on
mainsince this PR was opened address parts of that at the source:temporalio-clientandtemporalio-commonto 1.1.0 #10006 (BE-981) updatestemporalio-clientandtemporalio-commonto 1.1.0. 0.5.0 generated code in a different order on every build, so it and every crate depending on it (up tohash-graph-atlas) missed sccache on every run. [Test] Measure where thehash-graphcompile spends its time #10005 attributed about 80 seconds of the compile to that.^manifestincompileandcompile:release#10007 (SRE-1173) makescompileandcompile:releasedepend on^manifestin the rootturbo.json, so the compile's hash covers every workspace crate the binary links. It keepscache: falseuntil the binary is declared as an output.aws-lc-sysbuild script, which [Test] Measure where thehash-graphcompile spends its time #10005 measured at 98 seconds on the critical path.This PR has been rebased onto that
main(0879fe517c) and now contains only what remains on top: turning caching on, with the binary as an output. With all three in, a cold compile takes about 3 minutes, and caching the binary cuts that to 11–16 seconds (see the results below).10019 (SRE-1171) is complementary: it moves
hash-graph's code into a library crate that sccache can cache, which should make the cold compile faster still. This PR saves the whole compile when the graph's Rust inputs are unchanged; #10019 speeds up the compile when they aren't.Timings from six PR runs of
Integration (@tests/hash-playwright)before any of these changes:hash-graph, then wait for graph, API and frontend)yarn installturbo prune🔍 Changes
hash-graph#compileis cached, withtarget/debug/hash-graphas its only output. The build itself is unchanged. Its hash covers:^manifestdependency it inherits from the rootturbo.json(SRE-1173: Depend on^manifestincompileandcompile:release#10007);Cargo.lock. Turborepo's Cargo workspace support already hashes these per package; I confirmed it by changingtokio's version, which changed the hash;Cargo.toml, which holds the profiles and the workspace dependency versions. Onmainan edit to it doesn't change the compile's hash, which only becomes a problem once the binary is cached;CARGO_PROFILE_*andRUSTFLAGS, which change the binary if anyone sets them;RUNNER_OSandRUNNER_ARCH. Turborepo doesn't hash the platform, so without these a binary from another OS or architecture could be restored.apps/hash-graph/docs/task-dependencies.jsonis regenerated withturbo run //#doc:task-dependencies. The rootcompile: { cache: false }default stays for other packages, andcompile:releaseis unchanged.An earlier version of this PR also set
CARGO_PROFILE_DEV_DEBUG=line-tables-only. It was removed: it is a separate trade-off that hadn't been discussed. Debuggers lose variable and type information, and sccache would store a second copy of every crate, because other jobs still build with full debug info.❓ Open questions for infra
^manifestincompileandcompile:release#10007 explains that an earlier attempt failed in the merge queue because a cache hit restored no binary. Declaringtarget/debug/hash-graphas the output is meant to fix exactly that. Alternatives would be building the binary once per workflow and sharing it as an artifact, or running the graph from its Docker image.cargo buildalso fillstarget/for later Cargo commands in the same job. With a cache hit,cargo testin thehash-graph-integrationandhash-graph-benchesjobs no longer gets those artifacts. This only matters whentest:integrationmisses the Turborepo cache, and sccache still covers it. Is that trade-off acceptable?hash-graphcompile spends its time #10005), and every change to Rust code uploads a new one to the Vercel remote cache. It uploads and restores without errors, and a restore takes 13–16 seconds (see the results below), so the question is only storage and bandwidth. Is there a budget to respect? If this is too large, the options I can see are:line-tables-onlybrings it to 1.0 GB), with the drawbacks described above.-syscrates link from the system.main, the@tests/hash-backend-integrationjob restored the binary in the "Start background tasks" step, but its "Run tests" step ranturboagain and got a cache miss for the same hash (a6de408921a564de). Cargo then rebuilt the whole binary in 3m48s (with sccache hits). Onmaintoday the earlier compile leaves Cargo's build state intarget/, so a second compile finishes in seconds; with this PR only the binary is restored, so Cargo starts from nothing. This happened in 1 of the 6 backend-integration runs I have logs for. I couldn't find the cause because the workflow setsTURBO_GLOBAL_WARNING_DISABLED=1; a failed or timed-out download of the 2.9 GB artifact, which Turborepo reports as a miss, seems most likely. Possible fixes:compile, for example by running the test step with--only;🧪 How this is being tested
The current commit
e3018a6c43passed a cold run and a warm re-run againstmainat0879fe517c, which includes #10006, #10007 and #10010 (see "Results on currentmain" below). The checks below ran earlier on commitb2c22ea6c5, againstmainat615fca1e76, before #10010 merged.hash-graph#compilemissed the cache in every graph job and compiled in 3m26s–4m06s. sccache missed only 2 crates, down from 13, so BE-981: Updatetemporalio-clientandtemporalio-commonto 1.1.0 #10006 fixed the miss chain. This compile time is what caching saves on each run, before SRE-1172: Link a cached prebuilt AWS-LC in CI instead of compiling it every run #10010.a7054110a6changes only a doc comment inlibs/@local/graph/store/rust/src/lib.rs, a cratehash-graphdepends on. All six graph jobs missed the cache, recompiledhash-graph-storeand the binary (3m41s–4m38s), and passed. That commit will be reverted before this PR leaves draft.📊 Results on current
mainTest run 38395647308 on commit
e3018a6c43, with #10006, #10007 and #10010 onmain: attempt 1 ran on a cold cache, and attempt 2 re-ran every job on a warm cache. Both passed. In attempt 1 sccache missed only 2 crates and the prebuilt AWS-LC was used. In attempt 2 every graph job reported1 cached, 1 totalforhash-graph#compile. The Playwright job wasn't selected, because the commit doesn't touch any file its tests depend on."Start background tasks" step, in seconds:
hash-graph-integrationhash-graph-benches@tests/hash-graph-http@tests/hash-backend-integrationhash-apiran its data migrations for about 2 minutes 10 seconds before it started listening. That happens with or without this PR.📊 Results after the first rebase
These came from commit
b2c22ea6c5, before #10010 was onmain.Test run 38388077399: attempt 1 ran on a cold cache, and attempt 2 re-ran every job on a warm cache. The Playwright job wasn't selected in this run, because the commit doesn't touch any file its tests depend on.
"Start background tasks" step, in seconds:
hash-graph-benches@tests/hash-graph-httphash-graph-integration@tests/hash-backend-integration📊 Results before the rebase
These came from commit
9ea01d7c90, before #10006 and #10007 were onmain, with full debug info. The cache behaviour should carry over; the compile time it saves is expected to be smaller now that #10006 is in. Test run 38280632661: attempt 1 ran on a cold cache, attempt 2 re-ran every job on a warm cache.Every job that compiles the graph restored the binary from the remote cache in attempt 2. All five reported
1 cached, 1 totalforhash-graph#compile, and sccache executed no compiles. Restoring the 2.9 GB binary took 12.8–16 seconds. In attempt 1 the Playwright job compiled it in 4m39s (a cache miss), as expected."Start background tasks" step, in seconds (compile
hash-graph, then wait for the services):@tests/hash-playwright@tests/hash-backend-integrationhash-graph-integrationhash-graph-benches@tests/hash-graph-httpThe whole Playwright job took 774s in attempt 2, against 1,073–1,494s before this PR.
test:integrationtasks hit the Turborepo cache too. Only the "Start background tasks" column measures this change.hash-apistarting (about 1 minute 45 seconds in an earlier run). It is the next candidate to look at, outside this PR.